
Introduction
Work out gel bait syringe filling capacity by dividing the good, filled syringes you must ship by the productive hours your line can really run. That single calculation sets everything else: the number of dosing heads, the automation level, and the line stage you should buy. It is also the calculation most buyers skip.
Most capacity questions we receive start in the wrong place. A buyer asks how fast a machine runs, repeats a supplier’s nameplate figure, and treats that as the answer. A nameplate rate is a ceiling measured under ideal conditions. Your floor runs lower, and the gap is not small. This guide shows how to size gel bait syringe filling capacity from demand, how to turn a rated speed into good units per shift, and where output quietly leaks away.
The Short Answer: Size From Demand, Not Spec
Capacity planning runs backwards from a spec sheet. You do not pick a machine and then hunt for volume to fill it. You start with the volume you must ship and find the rate that clears it.
Take your realistic requirement for good units in a month. Add a safety margin. Divide by the productive hours the line can actually run in that month. The result is the effective rate you need.
Two numbers get blurred here, and separating them is the whole exercise. Your requirement is the demand side: what orders push through the line. Your capacity is what the line produces once you subtract the losses. Planning means keeping the second comfortably larger than the first, on your real product. We print no target figure for that reason; an invented rate becomes an invented budget.
Rated Speed Is a Ceiling, Not a Promise
Nameplate speed, also called rated speed, is the rate a machine reaches when everything is ideal: continuous feeding, perfect components, no changeovers, no minor stops, no rejects. It is a topping-out figure. It says what the mechanism can do for a moment, not what your shift delivers.
Between that ceiling and your good output sit five losses:
- Planned stops: breaks, shift handover, cleaning, and changeover of the paste supply.
- Changeovers: swapping barrel size, piston, tip, or gel recipe.
- Minor stops: a jammed barrel, a starved feeder, a cap that fails to seat and must be reset.
- Speed loss: running below the rated rate because the paste is thicker today, the room is colder, or the component fit slows the cycle.
- Quality loss: syringes that fail net content, leak, or seat their piston badly and get rejected.
A brochure rate should be treated as an ideal ceiling, not as a promise for a working line. Once these five losses are subtracted, the good-unit result can be materially lower. The gap is not automatically a machine fault; it is the distance between an ideal cycle and a production calculation.
That is why we ask every customer for the target they can hold across a full shift, not their best two minutes. If you say “1,200 per hour at peak”, we plan around the slower figure you can repeat, because your orders are built on the repeatable one.
From Syringes Per Minute to Good Units Per Shift
The conversion is a chain of subtractions followed by two multipliers. Work it in this order and the number you produce is one you can defend to your own management.
Step 1: find your net run time. Start with the shift length, remove planned breaks and handover, then remove changeover, start-up, and end-of-run time.
Net run time (min) = Shift length − Planned breaks − (Changeovers per shift × Changeover time) − Start-up time − End-of-run time
Step 2: turn run time into theoretical output. Multiply net run time by the rated speed.
Theoretical output (units) = Net run time × Rated speed
Step 3: apply a performance factor. This is the share of rated speed you actually average, after minor stops and speed loss. It sits between 0 and 1.
Step 4: apply a quality factor. This removes rejected units, so it equals 1 minus your reject rate.
Good units per shift = Net run time × Rated speed × Performance factor × (1 − Reject rate)
Or, as an hourly figure:
Effective rate (units/hour) = Rated speed (units/min) × 60 × Performance factor × (1 − Reject rate)
Two cautions. The performance and quality factors are the values people guess, and guesses run high, so take them from a trial or from your own records on a similar line. Keep the unit honest as well: gel bait sells by mass, so “good” means the net weight sits inside tolerance, not that a syringe merely left the machine. Our note on grams versus millilitres explains why net content is the control, not the barrel’s nominal volume.
Capacity Sizing Template
Fill this with your own figures. We are deliberately not printing example values, because an invented number here would simply become an incorrect budget.
| Variable | Symbol | Unit | Your value |
|---|---|---|---|
| Shift length | T_shift | minutes | |
| Planned breaks and handover | T_break | minutes | |
| Changeover time per changeover | T_co | minutes | |
| Changeovers per shift | N_co | count | |
| Start-up and warm-up | T_start | minutes | |
| End-of-run clean and pack-down | T_end | minutes | |
| Net run time | T_run | minutes | |
| Rated speed | R_rated | units/minute | |
| Performance factor | P | ratio 0–1 | |
| Reject rate | q | % | |
| Effective rate | R_eff | units/hour | |
| Shifts per day | N_shift | count | |
| Working days per month | D_month | days | |
| Good units per shift | Q_shift | units | |
| Good units per month | Q_month | units |
Then carry it to the month:
Good units per month ≈ Good units per shift × Shifts per day × Working days per month
If your formats change during the month, subtract those changeover events separately. They cost more than a changeover inside a shift, because each one also carries start-up and first-article checks.
More Heads Do Not Automatically Mean More Capacity
Adding dosing heads or parallel stations is the obvious route to more output, and it works, up to a point. Two heads filling in parallel roughly double the theoretical rate. They do not double your good output, and they bring costs worth pricing first.
The principle is simple: parallel heads split the same net run time across more dosing points, so each minute yields more syringes, provided the line can feed and clear them evenly. Where it can, this is often the cleanest way to add capacity.
The costs are real, and they compound:
- Footprint. More heads need a longer frame, more conveying, and more floor space, plus clear access for maintenance.
- Energy and air. Every head adds compressed-air draw, and pneumatics frequently set a plant’s peak air demand.
- Labour. A wider line may need a second operator to load, unload, or watch both ends.
- Changeover complexity. Every nozzle, fixture, and setting must change for the new format, so changeover time grows with head count.
- Single-point failure. One shared feeder, pump, or conveyor serves all heads, so a fault stops the whole line rather than one station.
That last point is the one buyers underestimate most. A four-head line with one upstream feeder is only as available as that feeder. If the paste supply starves the heads, four heads produce like two. This is why we size feeding and downstream handling before we add heads, and why we would rather sell two heads that run all shift than four that spend it waiting.
Size the Whole Line, Not the Filling Head
Planning capacity around one machine is the mistake we correct most often. Your output is set by the slowest station in the line, and it is rarely the dosing head.
Upstream, the paste must reach the pump at the right temperature, consistency, and rate. Thick or thixotropic bait does not flow on demand; it may need a follower plate, a transfer pump, or heated jacketing to keep feeding. If the paste is not there, the head cannot fill it, however fast it is rated.
Downstream, every filled syringe passes piston insertion, tip or cap closing, net-content checking, and often labelling before packing. Any of those can be the real constraint. A capping station slower than the filler leaves the filler waiting on every cycle.
So the planning question is not “how fast is the filler”. It is “which station finishes the fewest good units per hour”. Size the line so every station clears that number with margin, then buy capacity where the constraint actually sits. Our guide to moving from manual to automatic shows how the bottleneck shifts as each stage is automated.
What Changeovers Take Out of Your Month
Changeover time hits capacity twice, and the second hit is the one people forget.
The first hit is the changeover itself: the minutes the line stands still while you swap fixtures, nozzles, dosing parts, and settings. The second is frequency, because the same 30-minute changeover repeated twenty times a month removes far more output than one thirty-minute stop. The monthly loss follows directly:
Changeover loss per month (min) = Changeover time per changeover × Changeovers per month
Units lost to changeovers = Changeover loss per month × Effective rate
Two levers reduce this. You can shorten the changeover itself with repeatable, tool-light swaps, or cut the frequency by sequencing orders so fewer format changes land in a week. Both are planning decisions, and both usually cost less than buying extra speed to cover the loss. Our changeover planning guide covers the mechanics in detail.
In our experience, buyers who time a changeover with a stopwatch rather than estimating it are consistently surprised. A changeover that “takes about fifteen minutes” is often closer to forty once the first unit is filled, weighed, and accepted.
How to Set Your Demand Number
Capacity planning starts with demand, so this is where honesty matters most.
Work back from orders. If you have a firm annual volume or a set of purchase orders, convert them into a monthly figure, then a daily and shift figure. That is your baseline, and it is the number the line must beat.
Add a safety factor. Lines lose time to the unexpected, so a plan that runs the machine flat out has no room for a bad batch, a late component delivery, or a repair. Choose a margin that reflects your risk, and apply it to the demand number rather than to the machine spec.
Respect seasonality. Pest control demand is not flat. Many products sell harder in warm months and around regional pest seasons, so a machine sized to the annual average falls short in the peak and stands idle in the trough. If your peak lasts three months, either size for that window and accept idle time elsewhere, or build stock ahead of the season and level the load.
Plan for export batches. If you ship to distributors or export markets, orders often arrive large and infrequent. That pattern pushes the same total volume through fewer production days, which raises the rate you need on those days. A smooth domestic flow and a lumpy export flow can need the same annual capacity but very different peak capacity, and it is the peak that decides the machine.
Capacity Planning Misjudgments to Avoid
- Copying a competitor’s numbers. A rival’s rated speed is not your capacity. Their material, components, and shift pattern differ from yours, so their rate describes their line, not your demand.
- Buying for the peak. A machine sized to your busiest week sits idle for the rest of the year. Size to a realistic peak, not to a theoretical maximum.
- Ignoring incoming component variation. If barrel or piston dimensions drift batch to batch, the line slows and rejects rise. The state of incoming components is part of your capacity, not a separate quality issue.
- Forgetting inspection and sampling time. Net-content checks and sample pulls take time, and small-dose products are checked more often. Build that time into the plan rather than treating it as free.
- Assuming the paste is constant. Viscosity that shifts with temperature changes both fill rate and reject rate. Capacity on a cold morning is not capacity on a warm afternoon.
- Treating installation as free. Commissioning takes the line out of production, and a new line with a new team does not reach the planned rate on day one. Plan for a temporary dip during installation preparation and training, and count it as lost output.
What We Ask and Measure at a Trial
At a sample trial we do three things that shape the capacity answer.
First, we ask for your real eight-hour target, not your peak. A buyer who says “as fast as possible” gets a slower, safer plan. A buyer who says “900 units a shift, six days a week” gets a plan built to that number, with the losses already allowed for.
Second, we run your actual paste and your actual syringe, and we time the stable rate separately from the short burst. Almost every machine looks fast for two minutes and settles lower once the feeder, the paste, and the caps find their rhythm. The stable rate is the figure we build the plan around, and the one we can stand behind at factory acceptance.
Third, we record changeover time with a stopwatch and note which parts must be swapped for each format. That record becomes the changeover input in your template, and it stops you budgeting output you will not get. Shipment inspection follows the same logic: before dispatch we agree what “good” means, with the measurement method, sampling plan, and defect definitions written down, so the rate you saw at the trial is the rate we can prove before the line leaves.
FAQ
How many syringes per hour can a gel bait syringe filling machine produce?
There is no single figure, because output depends on the dosing method, the number of heads, the paste, the packaging, and the losses on your line. A semi-automatic bench machine and a multi-head automatic line are not comparable. The number that matters is your good units per shift, worked out with your own figures rather than a headline rate.
Is rated speed the same as real output?
No. Rated speed is a ceiling reached under ideal conditions with no stops, no changeovers, and no rejects. Real output is always lower, because time is lost to planned stops, changeovers, minor stops, speed loss, and quality rejects. Plan from real output, and treat the rated figure as an upper bound.
Should I buy more heads to raise capacity?
Only if the filling head is your constraint. If paste supply, cap closing, or the inspection station is slower, extra heads add cost without adding output. Size the whole line to its slowest station first, then add capacity where it actually helps.
How does changeover affect monthly capacity?
Every changeover stops the line, and repeating it many times removes a large share of the month. Multiply changeover time by the number of changeovers per month to see the loss, then reduce either the time or the frequency.
How much safety margin should I add?
Enough to cover the unexpected without leaving the machine idle for most of the year. The right margin depends on your order pattern, your seasonality, and how costly a missed batch would be. Size to a realistic peak, not to a theoretical maximum.
Conclusion
Capacity is a planning problem, not a spec-sheet problem. Start from the good units you must ship, work back through the time you really have, and let that figure set the machine. A rated speed is a ceiling. Your output is what survives the stops, the changeovers, and the rejects.
Define your demand, take your performance and quality factors from a trial rather than from optimism, and size the whole line to its slowest station. Do that and every quote becomes comparable, because you are asking suppliers to hit a real number instead of a brochure claim.
Send Us Your Output Target
Send us your target good units per shift, the formats you run, and your annual or monthly volume. Tell us your expected changeover frequency and your reject tolerance. We will review your product, recommend a dosing approach and line stage, and run a sample trial on your actual paste and packaging, so the capacity figure is measured rather than assumed. An engineer replies, with no pressure and no obligation.
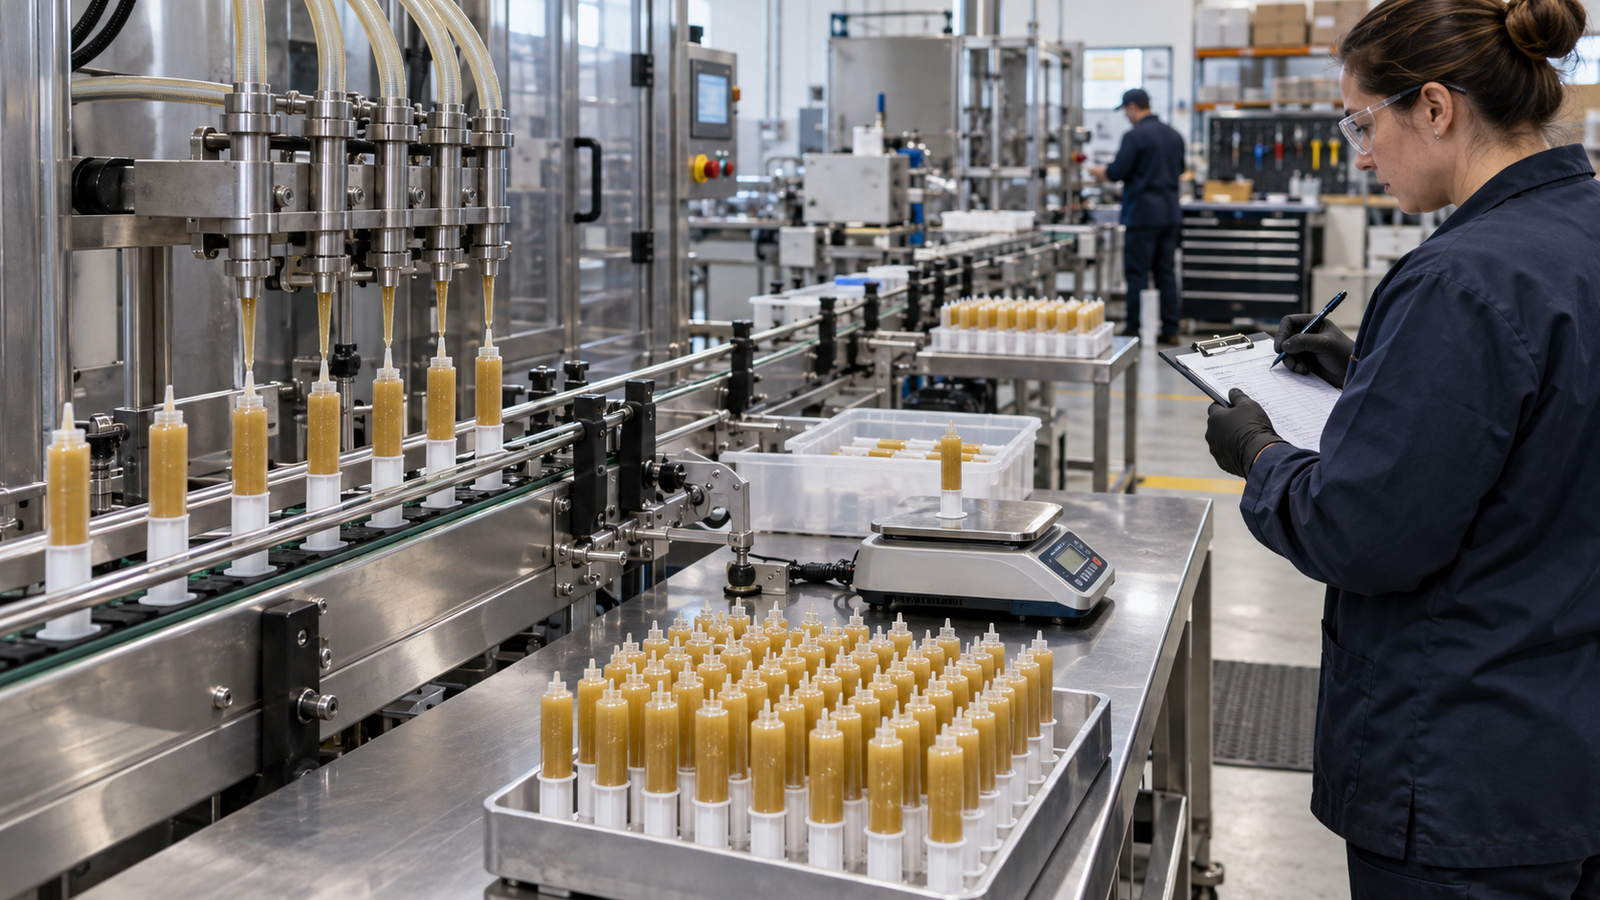
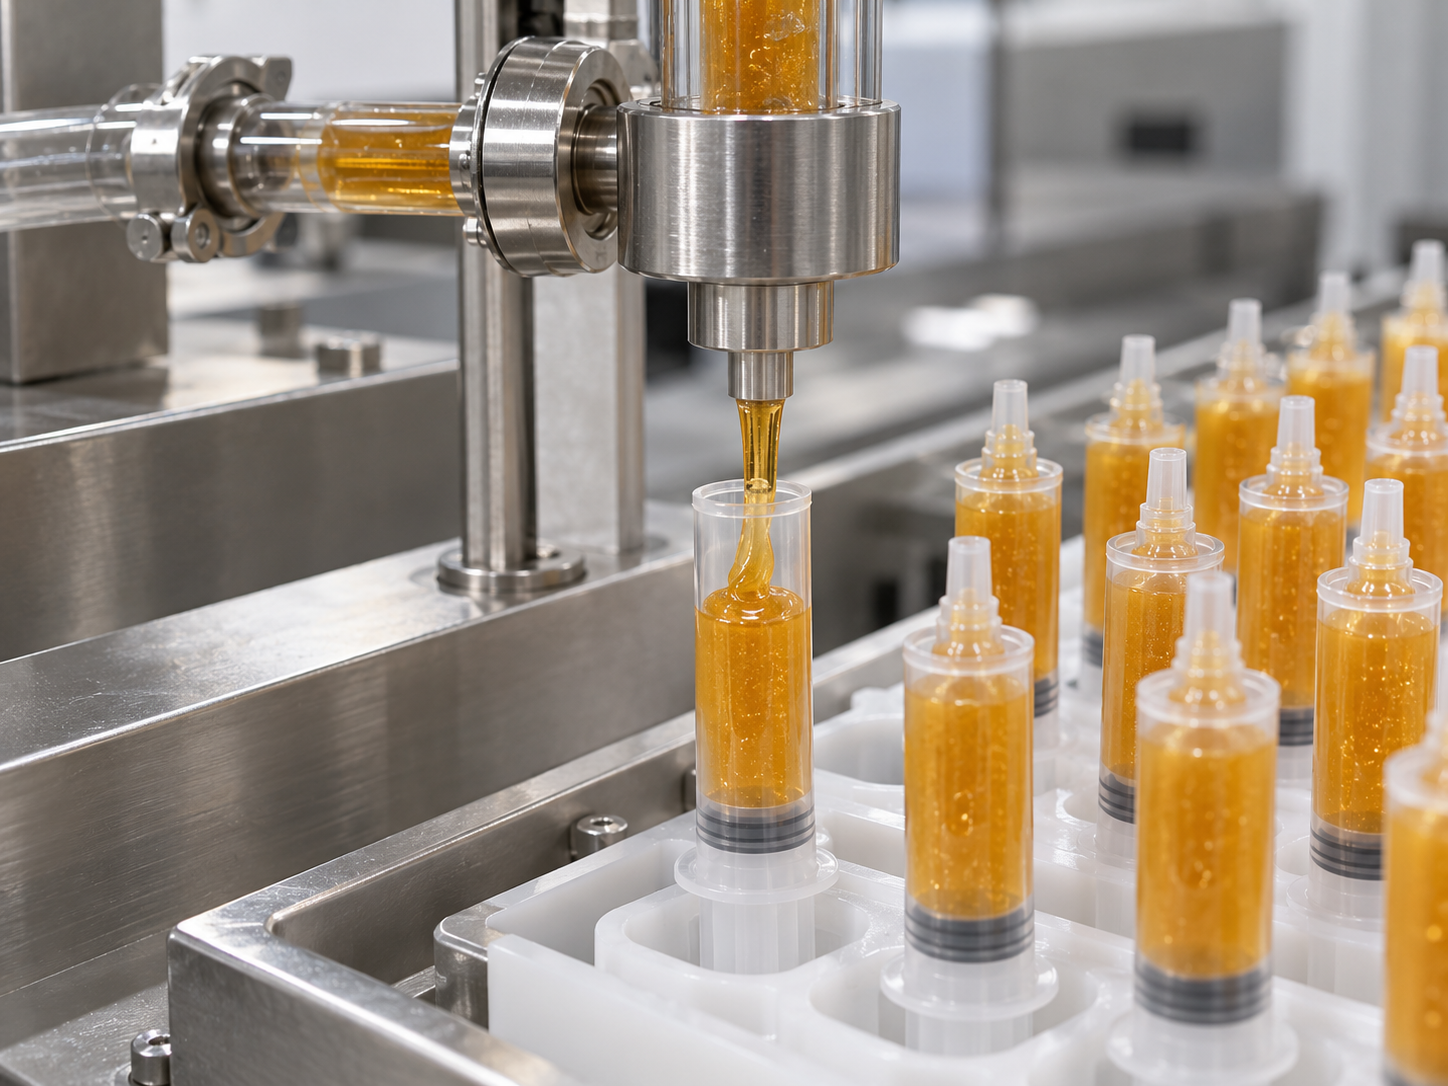
These visuals show the type of evidence a buyer can request during a gel bait syringe capacity review. They are illustrative engineering visuals, not a guarantee of output or filling accuracy. Confirm the final figure with your product, syringe format, staffing plan and acceptance criteria.



Related resources for your RFQ
For a complete equipment review, compare the syringe filling machine range with the relevant veterinary filling solutions and the dosing paste syringe application. If the line includes a broader packaging flow, review the filling and capping line category and the complete line solution approach.
For practical comparisons, see grams versus millilitres in gel bait syringe filling, the move from manual to automatic gel bait filling, and changeover planning for gel bait syringe formats. If packaging continues to cartoning, consider the cartoning machine category and the available machinery range.
Prepare your actual syringe drawing, gel samples, target good units and shift assumptions before you contact King Pack Machinery or request a technical quotation. This makes the capacity discussion more useful than comparing headline speeds alone.