 Skip to content
Introduction
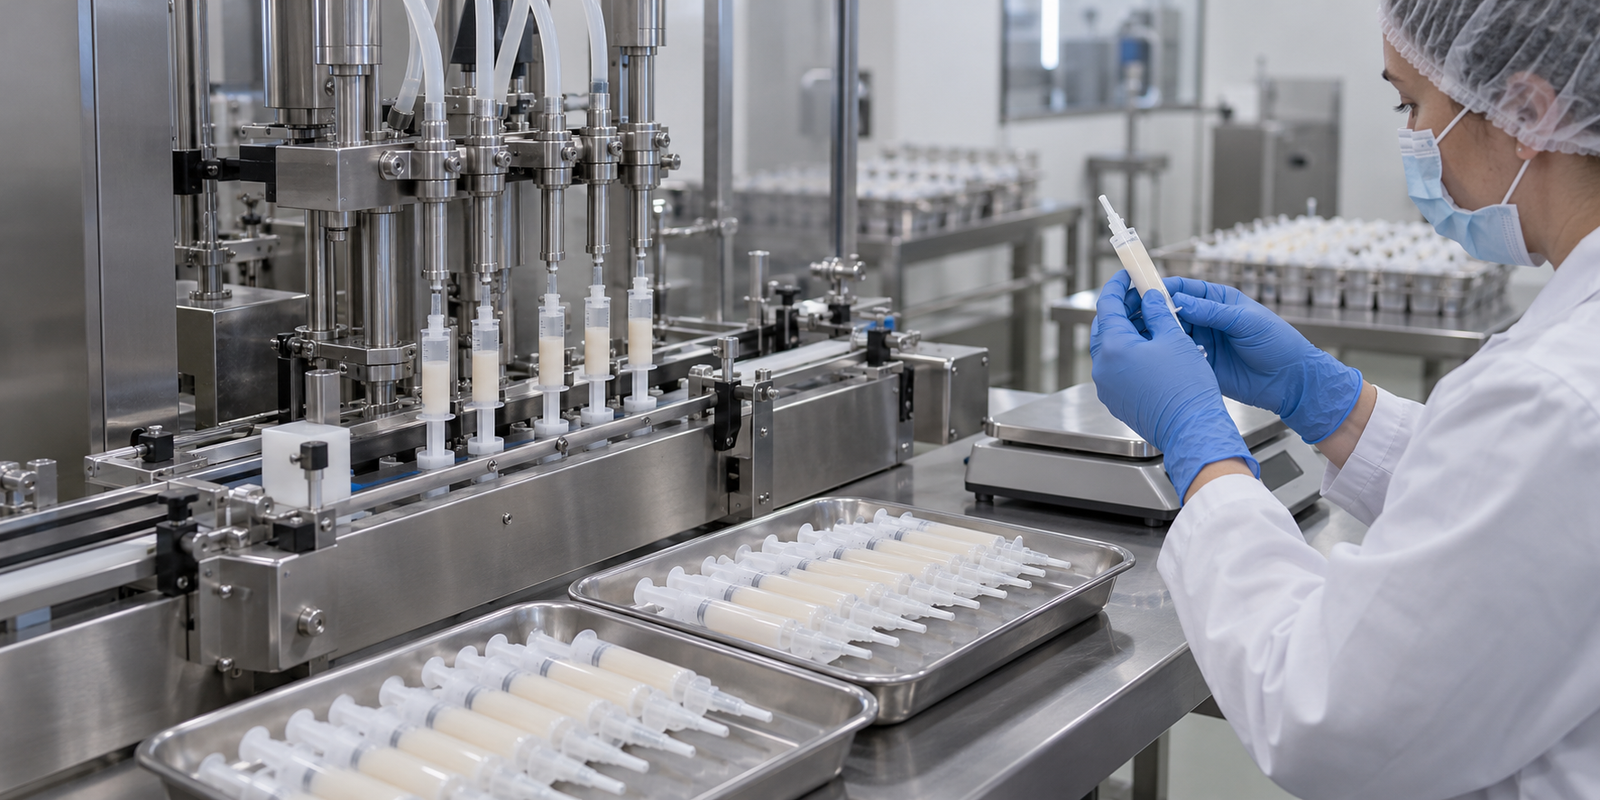
Ask three suppliers for the cost per unit of filling a gel bait syringe and you get three numbers that are not comparable. Each one is a quote shaped by what that supplier chose to include, not a calculation you can trust. The syringe filling machine cost per unit that decides your margin is not the machine price. It is what one good, saleable syringe costs you after material, packaging, labour, machine time, rejects, and changeover are all counted. That figure is yours to compute.
This article gives you the formula, the cost buckets it draws from, and a template you fill in with your own numbers. We do not publish a per-unit figure, because a real one depends on your gel, your syringe, your labour rate, and your output. What we can give you is the arithmetic, so the number you take to finance is one you built and can defend.
What “Per Unit” Has To Mean
Most buyers count the units that came off the line and divide total cost by that. It hides the two things that quietly ruin margins: rejects and overfill.
A syringe that fails your net-content check still consumed gel, a barrel, a piston, a tip, and machine time. It earned nothing. Divide by total output instead of good output and you spread that loss across the units that did sell, so your filling cost per unit looks better than reality.
Fix the denominator first. Good units are the syringes that pass your net-content check and your visual check and reach a saleable carton. Everything the line produced that did not make it is cost with no revenue attached. Write that definition down before you touch a calculator; it sets the target for every number below.
The Cost Buckets Behind One Filled Syringe
One filled syringe carries nine cost buckets. Some rise with every unit, and some sit still inside a run and get spread across the units in it. Separating the two is half the work.
| Cost bucket | What it covers | Fixed or variable in a run | Where buyers misjudge it |
|---|---|---|---|
| Gel bait material | Paste dosed per unit, plus overfill, priming, purge, and stringing losses | Variable | Overfill looks like a good fill until you add up the grams given away |
| Packaging components | Barrel, piston, plunger rod, and tip or cap, per format | Variable | Change parts and minimum order quantities get ignored |
| Direct labour | Operators loading, closing, checking, and packing, plus setup and clean-down | Fixed per shift | Only line time is counted; setup and cleaning labour is treated as free |
| Equipment depreciation | Landed machine and tooling cost spread over life or annual hours | Fixed per hour | Machine price is used in place of landed cost |
| Energy and compressed air | Motors, heaters, and air demand from valves and pneumatic axes | Mixed | Air is treated as free because it has no meter of its own |
| Rejects and rework | Scrapped units, material lost, and rework labour | Variable | Left out of the denominator as well as the numerator |
| Inspection and QC | Checkweighing, sampling, retention samples, and records | Fixed per run | Sampling time is assumed to cost nothing |
| Changeover downtime | Hours lost switching format, including first-article checks | Fixed per changeover | Counted in output but not in cost |
| Spares, maintenance, consumables | Seals, O-rings, peristaltic tubes, nozzles, calibration | Fixed per period | Missing from the quote entirely |

Two notes on that table. First, “fixed in a run” does not mean fixed forever. Labour, machine hour rate, and changeover cost all move when your volume or format count changes. Second, overfill deserves care. Gel bait is sold by mass, so every extra gram you dose is product you paid for and gave away. A generous fill target looks safe on the line and shows up as lost margin at year end.

The Cost Per Good Unit Formula
Here is the working formula. It uses variables rather than numbers, because your numbers are the only ones that count.
Cost per good unit = (M + C + L + (R × H) + Q) ÷ G
Where:
- M = material cost for the run: grams dosed per unit (including overfill) × units × cost per gram.
- C = component cost for the run: barrels, pistons, plunger rods, and tips or caps at your landed cost.
- L = direct labour for the run: operators × hours × loaded hourly rate, including setup and clean-down.
- R = machine hour rate, built in the next section.
- H = machine hours for the run: production hours plus setup, first-article checks, and cleaning.
- Q = quality and reject cost for the run: scrapped material and components at cost, plus rework labour.
- G = good units out: the units that passed inspection.
Keep the double count out. If M is the material issued to the run, then put the scrapped fraction in Q only as the components and labour you cannot recover. Decide which way you are counting and stay consistent, or you will count the same gram twice.
The reject rate links G back to the line. If T is total units produced and p is the reject rate as a fraction, then G = T × (1 − p). A reject costs you three times over, since it consumes material, a component, and machine time, and it earns nothing. That is why a small reject rate moves the cost to fill a syringe more than most people expect.
For equipment scope, compare the syringe filling machine configuration, the veterinary filling solution and the FAT documentation scope before assigning an hourly cost.
How to Build Your Machine Hour Rate
The machine hour rate is where buyers most often stop short, because the machine price is not the machine cost, and the price drivers sit elsewhere.
Start with landed cost. That is the machine, plus tooling and change parts, freight and rigging, installation, commissioning, operator training, and the engineering hours behind documentation such as a factory acceptance test record. Add what you spend after delivery as well: maintenance, spare parts, calibration, and the floor space the line occupies.
Then choose a spreading basis. One is straight-line over the machine’s working life, commonly five to eight years. The other is over annual effective machine hours. The first captures that the asset wears out and will be replaced. The second captures that idle hours still cost you, because the capital sits there whether the line runs or not.
R = (landed cost ÷ life in years + annual upkeep) ÷ annual effective machine hours
Two things we tell buyers from our own floor. First, installation and commissioning consume machine hours you cannot sell. In our experience the weeks around handover temporarily cut available output, so the first month after installation is not the month to judge the line’s economics. Second, a second shift cuts the machine hour rate fastest, because the capital is already paid for.
Labour and Real Throughput
Rated speed is a ceiling, not a promise of output. Every machine we ship has a rated cycle, and every real shift produces less. The gap is where cost per unit lives.
Work out effective output before you divide anything:
Effective output per shift = (shift minutes − break minutes − changeover minutes − startup and clean-down minutes − micro-stop minutes) × rated units per minute × (1 − reject rate)
Each term is real. Breaks and changeovers are scheduled, so they should never surprise you. Micro-stops, the small jams and waiting nobody logs, are the term people under-count, and they often cost more than changeovers. Read the rated number, then subtract honestly.
Labour follows the same logic. Direct labour per unit is (operators × loaded hourly rate × hours) ÷ good units. In a manual or bench setup, labour is often the largest variable bucket, and it scales with the hands the line needs. In a fully automatic line, material and machine hour rate take over, and labour per unit falls as one operator oversees the run.
The Numbers You Fill In Yourself
The table below is the template. It holds variable names and units only. No values, because the values are yours.
| Variable | Symbol | Unit | Where it comes from |
|---|---|---|---|
| Material dosed per unit | m | g/unit | fill target plus overfill |
| Material cost | cm | currency/g | batch or supplier cost |
| Component cost per unit | cc | currency/unit | barrel + piston + rod + cap |
| Good units per shift | G | units | effective output formula |
| Reject rate | p | % | trial and production data |
| Machine hour rate | R | currency/hour | previous section |
| Machine hours per run | H | hours | run + setup + cleaning |
| Direct labour cost per run | L | currency | operators × hours × rate |
| Quality and reject cost per run | Q | currency | scrap + rework |
| Cost per good unit | — | currency/unit | the main formula |
| Annual good units | A | units/year | sales or order forecast |
| Landed investment | I | currency | machine + tooling + install |
| Annual saving | S | currency/year | baseline minus projected |
| Payback | — | months | I ÷ (S ÷ 12) |
Fill the inputs from your own records or your trial, run the formula, then change one variable at a time to see which one moves the answer the most. In most gel bait operations it is labour and rejects, not material, that decide the outcome. Knowing that before you negotiate keeps the talk on the right line.
Manual vs Semi-Automatic vs Fully Automatic: Where the Breakeven Sits
Automation is not a moral upgrade. It trades capital for labour and consistency, and the trade only pays when three variables line up: annual volume, labour cost, and reject rate. The manual to automatic guide works through that trade.
A manual or bench setup carries the lowest capital and the highest labour per unit. An integrated semi-automatic line cuts hands per unit and steadies the fill. A full automatic line cuts labour further and usually holds the tightest reject rate, provided it is fed and running.
The comparison you want is not machine price against machine price, but cost per good unit at your volume on both sides of the decision. Automation earns its capital when the saving per unit, multiplied by your annual good units, beats the fixed cost the new line adds. That is your breakeven volume, and it moves the moment your labour rate or reject rate changes. A plant with expensive labour and a high reject rate reaches breakeven at far lower volume than one with cheap labour.
Size for the shift you actually run, not the peak you hope for. Idle capacity still carries maintenance, floor space, and depreciation, so automation for volume you do not have raises cost per unit.
ROI and Payback: The Steps
Payback turns the cost per unit work into a single figure your finance team will accept. It is where syringe filling ROI becomes a number instead of a feeling. Five steps.
Step 1, baseline. Measure today’s cost per good unit on your current process, using the formula above. If you contract fill, that is the per-unit rate plus your own quality and freight costs.
Step 2, project. Estimate cost per good unit with the new line, using the cycle time and reject rate you measured at the sample trial, not the catalogue figures.
Step 3, annual saving. Annual saving = (baseline cost per unit − projected cost per unit) × annual good units. Add what you save on rework, scrap, and overtime where you can measure it.
Step 4, net investment. Net investment = landed machine cost + sample trial cost + acceptance testing cost (see the FAT checklist) + shipment inspection + installation and commissioning + training + first spares kit − salvage value of the equipment you replace.
Step 5, payback. Payback months = net investment ÷ (annual saving ÷ 12). A filling machine payback period under your own threshold is what makes the case, and that threshold is a business decision, not an engineering one.
Step 4 separates the honest buyer from the optimistic one. Trial material, your engineers’ time at the factory, and the acceptance work at shipment are real costs, and a payback that ignores them flatters itself. Put them in and the number still stands when the first invoice arrives.
What Buyers Leave Out of the Quote
The per-unit figure is only as honest as the cost list behind it. These are the items buyers most often leave out.
- Spare parts kit. Seals, O-rings, peristaltic tubes, nozzles, and fixture pads. Consumables are a running cost, not an afterthought.
- Operator training hours. Training takes your people off the line and takes the supplier’s engineer off theirs.
- Validation and documentation hours. If your market needs a documented installation or operational qualification, that is engineering time, not paperwork you receive for free.
- Sample trial material and staff time. Gel, components, and the people who run the trial.
- Freight, rigging, and installation preparation. Power, compressed air, drainage, and floor preparation often land before the machine does.
- Software and recipe set-up. Building and proving your format recipes is time on the clock.
In our experience, shipment inspection and installation preparation absorb labour that never shows in a machine quote. Include the people you pull off normal work for a few days on each side of delivery in the investment figure.
Common Misjudgments
- Using rated speed as output. It is a ceiling. Cost per unit comes from effective output.
- Ignoring overfill. Every extra gram is product you paid for and did not sell.
- Counting changeover in output but not in cost. Short runs pay for it twice. See the changeover planning guide.
- Leaving rejects out of the denominator. They belong there.
- Comparing headline totals. Two quotes are only comparable when the scope behind them matches.
- Sizing for peak demand. Idle capacity raises cost per unit rather than lowering it.
FAQ
Q: What is a good cost per unit for gel bait syringe filling?
There is no universal figure, because it depends on your material cost, labour rate, reject rate, and volume. The useful target is your own baseline: measure cost per good unit on your current process, then compare any new line or contract rate to it. A number from another plant with a different gel and wage structure tells you little.
Q: Does the machine price decide cost per unit?
Only partly. The machine enters through the machine hour rate, which spreads its landed cost, plus maintenance and floor space, across the hours you actually run. Labour, material, and rejects often move cost per unit more than the machine line does, especially at low volume.
Q: How do I account for rejects?
Divide by good units, not total output, and add the scrapped material, components, and labour to the numerator. If p is your reject rate, then good units = total produced × (1 − p). A reject costs material, a component, and machine time while earning nothing.
Q: How long should the payback period be?
That threshold is a business decision, not an engineering one. Set it with your finance team, then check whether the projected saving clears it. Use trial-measured cycle time and reject rate in the projection so the payback is not built on catalogue figures.
Q: Should the sample trial cost count in the investment?
Yes. Trial material, your staff’s time, and the acceptance testing around shipment are real costs. Leaving them out makes the payback look shorter than it is. Counting them keeps the figure defensible once production starts.
Conclusion
Cost per unit is the number that decides whether filling your own syringes beats buying the service, and it is the number most buyers estimate instead of calculate. Build it from the buckets, divide by good units, and use trial-measured cycle time and reject rate rather than the catalogue. Then the machine price stops being the whole conversation and becomes one input among several.
The payback follows from there. Baseline the current cost, project the new one, subtract to reach the annual saving, add every real cost to the investment, and divide. If it clears your threshold, the machine has earned its place. If it does not, you learned that before you signed, which is the cheaper place to learn it.
Send Us Your Numbers
Ready to turn your assumptions into a comparable quotation? Send your product, package, target output and labour assumptions for a technical cost review.
Send us your gel, syringe, and closure details, your fill target in grams, your labour rate, and your output per shift. An engineer will review your requirements and walk the cost-per-unit formula with you, then recommend a dosing system and line stage and run a sample trial on your actual product. If you are still building the baseline, tell us your volume and reject rate and we will help you work the arithmetic. No obligation.
