

Last reviewed: September 4, 2026.
A vial filler should not be sized from an annual demand number divided by an advertised bottles-per-minute figure. Veterinary production loses usable time to line clearance, sterilization or sanitation where applicable, component preparation, environmental release, recipe setup, in-process checks, interventions, changeover and batch reconciliation. Yield and the slowest connected machine further reduce the number of saleable units produced.
The correct decision starts with required good vials by product and campaign, converts demand into a net production rate over realistic available hours, and then tests whether washing, depyrogenation, filling, stoppering, capping, inspection and accumulation can sustain the same rate. Pilot and small-batch lines may deliberately trade speed for flexibility and containment, while production lines need stronger balance, redundancy and data.
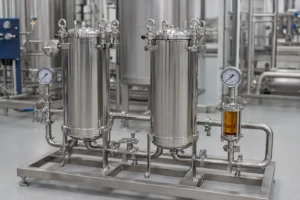

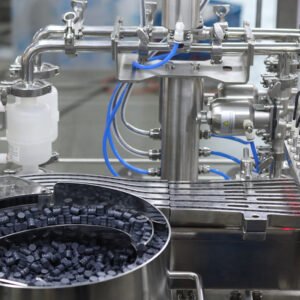
This guide provides a transparent calculation method and an illustrative scenario. The numbers in the scenario are assumptions, not KING PACK guarantees or industry norms. Final sizing requires the customer’s containers, closures, formulation, process route, utilities and representative product testing.
Quick answer: Size a veterinary vial filling line from the required good-vial demand during the true production window, then divide by justified yield and OEE assumptions to estimate the necessary demonstrated line rate. Confirm that every linked operation can sustain that rate with the intended vial, stopper, cap, fill volume and process conditions during a representative FAT; sample testing and site qualification must confirm the final operating window.
1. Start with Good Vials Required, Not Nameplate Speed
Direct answer: Capacity is acceptable when the line can deliver the required conforming, closed and reconciled vials within the production calendar at a justified risk margin.
Separate forecast demand from committed service demand, launch stock, validation batches, stability batches and expected rejects. Build the requirement by stock-keeping unit because vial diameter, fill volume, closure and process may change speed and changeover time. Summing everything into one annual number can conceal a high-volume format that dominates the bottleneck.
Define the planning horizon and service rule. A buyer may need enough capacity for an annual forecast, a peak month, a campaign before a maintenance shutdown or a fixed number of batches after environmental release. Record the rule so the supplier can calculate the same answer and so procurement can compare proposals on equal assumptions.
2. Build a Batch and Campaign Demand Model
Direct answer: The model should state batch volume, target fill, expected good vials, batches per campaign, campaigns per year and the disposition of partial containers and process losses.
Calculate theoretical vials from usable bulk volume divided by target fill, then apply the approved planning allowance for line and sampling losses. Do not double-count yield by subtracting the same loss at both batch-volume and finished-vial stages. Include extra units needed for in-process checks, retain samples, release testing and setup where these are part of the site procedure.
Campaign planning matters because one ten-batch campaign uses fewer full line clearances than ten isolated batches. At the same time, longer campaigns can increase component staging, bulk hold and maintenance requirements. The capacity model should show both production minutes and fixed time per batch or campaign.
3. Create a Time Ledger for Every Production Day
Direct answer: Available time is scheduled shift time minus planned activities that make the line unavailable; do not bury those losses inside an optimistic OEE value.
List shift length, breaks, line clearance, cleaning, sterilization where required, component loading, environmental or quality release, recipe setup, format verification, start-up checks, routine sampling, batch change, changeover and planned maintenance. Identify which activities overlap. Stopper preparation may occur while the previous batch runs, but only if staffing, rooms, equipment and material status allow it.
Maintain separate planned-time and run-time fields. OEE is commonly expressed as availability multiplied by performance and quality, but organizations define calendars and exclusions differently. Comparing two OEE percentages is meaningless unless the numerator, denominator and excluded events use the same definitions.
4. Convert the Requirement into a Demonstrated Line Rate
Direct answer: Required demonstrated rate equals good-vial demand divided by net scheduled production hours, yield and the chosen availability/performance allowance.
Use a transparent formula rather than one blended safety factor. One practical model is: required nameplate-equivalent rate = required good units / (scheduled run hours x availability x performance x quality yield). If quality is already included in the site’s OEE definition, do not apply it again. Add project margin only after the model shows each factor.
The result is a starting requirement, not proof. The proposed machine must run the relevant vial and product at that rate while meeting the user’s fill, closure, cosmetic, intervention and reject criteria. Use the liquid filling machine selection guide to collect viscosity, fill-volume and container inputs that influence filling behavior.
5. Keep Filling Physics Inside the Capacity Calculation
Direct answer: A cycle rate is usable only when the dosing system can complete fill, suck-back or cutoff and nozzle movement without foam, drip, stringing or out-of-specification results.
Record fill-volume range, viscosity versus temperature, surface tension, foaming, particulates, oxygen sensitivity, dose tolerance and acceptable product hold. Small fills can be limited by resolution and settling time; larger or viscous fills can be limited by product transfer, nozzle size and container dwell. Multiple nozzles improve nominal output only when the feed system maintains consistent conditions across heads.
The choice among piston, peristaltic, magnetic or other metering approaches changes product contact, accuracy development, cleaning and throughput. The filling pump comparison helps frame that decision. Final capacity should come from representative product or a scientifically justified simulant under the intended operating range.
6. Define the Washing, Depyrogenation and Filling Boundary
Direct answer: Line capacity cannot exceed the slowest required upstream component-preparation step or the available buffer between that step and filling.
State whether vials arrive ready to use or pass through washing and dry-heat treatment. For bulk vials, model washer output, tunnel belt speed and load pattern, heat-up and cool-down constraints, accumulation, transfer stability and format range. A tunnel may sustain an average rate yet fail to supply vials after a stop if the downstream line has no suitable buffer strategy.
For sterile products, define the aseptic boundary and applicable contamination-control requirements before selecting architecture. For nonsterile veterinary vials, do not add sterile equipment by default; instead, specify the product’s validated cleanliness and microbial-control process. In both cases, component status, staging and line clearance consume capacity and require traceable responsibility.
7. Balance Filler, Stopper and Capper as One System
Direct answer: The guaranteed line rate should be the sustained conforming output of the complete sequence, not the highest standalone speed of any one machine.
Map the cycle and failure modes of the KING PACK filling and capping line. The filler may pause for an in-process check; the stopper bowl may starve; a cap feeder may jam; or a reject station may fill its bin. Short accumulation can decouple minor stops, but it cannot rescue a permanently undersized closer.
Define machine-to-machine signals, starved and blocked behavior, restart sequence, container tracking and reject confirmation. If each machine uses a different speed basis, translate all claims into conforming vials per minute over the same test window. Include closure-presence and placement checks where required by the user’s control strategy.
| Operation | Capacity input | Common hidden constraint | Evidence |
|---|---|---|---|
| Vial preparation | Vial size, load pattern, release route | Heat/cool balance or staging | Sustained supply record |
| Filling | Fill volume, product properties, heads | Dose time, foam, drip, IPC stops | Weight/volume results and trends |
| Stoppering | Stopper geometry and bowl refill | Misfeed, partial seating, starvation | Placement and reject challenge |
| Capping | Cap/seal type and feeder duty | Torque/crimp window and jams | Closure result at line rate |
| Inspection/reject | Defect logic and tracking | False rejects and full reject bin | Challenge and reconciliation |
8. Use OEE as a Transparent Planning Assumption
Direct answer: OEE should expose availability, performance and quality losses; it should not be used to make a weak nameplate estimate appear scientific.
Use site data from comparable lines where available. New facilities can create low, expected and improved scenarios, clearly labeled as assumptions. Availability includes defined downtime during planned production; performance compares actual rate with the agreed ideal rate; quality reflects conforming output. Document whether setup, cleaning and planned breaks are inside or outside the scheduled production time.
Capacity should be robust to plausible variation. Run sensitivity cases for one fewer shift, a longer changeover, lower yield, a slower critical format and a campaign with more sampling. A proposal that works only under the best OEE case has little operational margin even if its advertised speed is high.
9. Worked Example with Clearly Labeled Assumptions
Direct answer: A worked model shows how assumptions change the requirement, but it is not a performance promise and must be replaced with customer data before order.
Assume, only for illustration, 4.8 million good vials per year, 220 production days and two 7.5-hour net scheduled shifts per day. The required average good output is about 1,455 vials per hour. If the planning model separately assumes 98% quality yield and 65% combined availability and performance, the nameplate-equivalent requirement is about 2,284 vials per hour, or 38 vials per minute.
The calculation does not prove that a 40-vial-per-minute line is sufficient. The team must add growth or service margin, verify whether net shift time already excludes setup, avoid double-counting quality inside OEE, and test every connected operation. A high-volume format may require a higher rate even when the annual average appears comfortable.
| Illustrative input | Assumption | Calculation role | Buyer action |
|---|---|---|---|
| Annual good vials | 4,800,000 | Demand numerator | Replace with SKU forecast and service stock |
| Net scheduled hours | 3,300 h/year | 220 days x 15 h | Confirm exclusions and overlaps |
| Good output | 1,455 vials/h | Demand divided by net hours | Check peak campaign, not only annual average |
| Quality yield | 98% | Illustrative loss factor | Use comparable validated data or scenario range |
| Availability x performance | 65% | Illustrative operating factor | Define event calendar and source data |
| Equivalent rate | 2,284 vials/h | About 38 vials/min | Add justified margin and prove by FAT |
10. Match Architecture to Pilot, Small-Batch or Production Duty
Direct answer: Pilot lines prioritize controlled flexibility and small product loss; production lines prioritize sustained balance, automation and repeatable changeover.
A pilot system may use one or two filling positions, manual component loading and contained small product vessels. The evaluation focuses on dose development, recipe control, cleanability and scale-up data. A small-batch system often needs automatic handling with rapid format changes and limited bulk loss, while a production line may justify higher nozzle count, continuous component feeding, accumulation and automated inspection.
Do not confuse a compact footprint with low total capacity. If component preparation, room release and cleaning dominate the batch, a faster filler may save little time. Conversely, a pilot machine can become a serious bottleneck when commercial batch count rises even if each batch remains small.
11. Include Format Range and Changeover Capacity
Direct answer: The capacity model should reserve time for every planned vial, stopper and cap change and should test the most demanding format at the required rate.
Create a format matrix with vial dimensions, stability, neck finish, fill volume, stopper, cap or aluminum seal, closure presentation and annual campaign count. Identify shared and unique change parts. A wide range can increase adjustment, cleaning, verification and spare-part inventory even when the main frame supports all formats.
Measure changeover from the last conforming vial of the outgoing format to the first approved vial of the next format, using the site’s actual clearance and documentation steps. Separate mechanical change time from cleaning and quality release. Tool-less adjustments and saved recipes can help, but only a witnessed procedure can support the planning allowance.
12. Account for Aseptic Preparation and Human Interventions Where Applicable
Direct answer: For aseptic veterinary products, viable capacity is constrained by the contamination-control strategy, intervention profile, environmental controls and validated operating duration as well as machine speed.
Define equipment preparation, sterilized component transfer, line setup, environmental release, glove or barrier-system operations, in-process sampling and intervention recovery. A faster mechanical cycle is not valuable if it increases interventions, stopper replenishment or operator reach into the critical zone. The project team should link staffing and material flow to the aseptic process simulation strategy.
The KING PACK pharmaceutical and veterinary industry solutions provide broad application context, but the manufacturer must determine the relevant veterinary GMP and sterile-manufacturing obligations for each market. Nonsterile projects should use their own risk-based hygiene and microbial controls rather than borrowing aseptic claims.
13. Make the Sustained-Run FAT Prove the Capacity Claim
Direct answer: FAT should demonstrate conforming output over an agreed run window with representative components and product behavior while recording stops, rejects and interventions.
Agree the vial, stopper, cap, fill medium, batch quantity, target rate, acceptance criteria, sampling plan and event definitions before FAT. Challenge start, normal run, refill, planned stop, restart, low-level conditions, missing components, reject tracking and end-of-batch behavior. Record actual good units, run time, downtime reasons, fill results, closure results and unresolved deviations.
A short burst at target speed is not a sustained-capacity test. The protocol should be long enough to expose component feeding, product supply, accumulation and ordinary operator tasks. Site acceptance and qualification must repeat installation-dependent checks with final utilities, environmental conditions, trained operators and approved materials.
14. How to Evaluate a Veterinary Vial-Line Supplier
Direct answer: Select a supplier that exposes the calculation, tests the complete line and states the conditions and exclusions behind every rate claim.
- Require an SKU-level capacity workbook with batch, campaign, shift, yield and OEE assumptions.
- Ask for a time ledger that separates cleaning, setup, line clearance, preparation and run time.
- Compare complete-line conforming output, not isolated machine maximums.
- Review vial, stopper and cap samples, drawings, tolerances and component-supplier data.
- Agree a representative-product or justified-simulant test and sustained-run FAT protocol.
- Confirm utilities, layout, electrical drawings, spare parts, IQ/OQ support and site commissioning scope.
- Check the exact scope of CE, ISO and regulatory evidence; do not infer product approval from equipment certificates.
15. How KING PACK Can Support Capacity Planning
Direct answer: KING PACK can translate the customer’s demand, batch, format and process inputs into a transparent line-balance proposal and a testable FAT rate.
KING PACK Machinery is a China-based manufacturer of pharmaceutical, veterinary, cosmetic and liquid filling and packaging equipment, with core solutions covering tube filling and sealing, vacuum emulsifying, liquid filling, pet spot-on filling and prefilled syringe production systems.
For a veterinary vial project, KING PACK can review bulk presentation, fill range, vial and closure samples, washing or ready-to-use boundary, filling and stoppering sequence, cap handling, controls, rejects, cleaning, format changes and documentation. The resulting proposal should state assumptions, bottlenecks, exclusions and site-dependent qualification work.
Send the SKU forecast, batch sizes, product properties, vial drawings and samples, closure specifications, shift calendar, target service level, yield/OEE scenarios, utilities and required documentation through the KING PACK contact page. That input enables a pilot-to-production recommendation grounded in the real production window.
Frequently Asked Questions
How do I calculate required veterinary vial filling speed?
Divide required good vials by realistic net run hours, then adjust once for clearly defined availability, performance and quality factors. Add justified margin and validate the complete line with samples.
Should I size from annual average demand?
Not alone. Check peak campaigns, launch stock, high-volume formats, maintenance periods and service requirements. The limiting window may be much shorter than a year.
What OEE should a new vial line assume?
There is no universal value. Use comparable site data or transparent low, expected and improved scenarios, and define which losses are included in each factor.
Can filler nameplate speed be used as line capacity?
No. Complete-line capacity is limited by vial preparation, product supply, stoppering, capping, inspection, accumulation, interventions and conforming yield.
When does a pilot line become too small?
When required batch count, campaign time, component loading, changeover or validation demand consumes the available calendar. Evaluate total time, not only units per minute.
How should changeover time be measured?
Measure from the last conforming unit of the outgoing format to the first approved unit of the next format, including the site’s required clearance, cleaning and verification steps.
What should a sustained-run FAT record?
Record good units, run time, stop reasons, rejects, interventions, fill results, closure results, component refills and deviations over the agreed representative run.
Which inputs should be sent with an RFQ?
Send SKU demand, batch sizes, fill volumes, product properties, vial and closure data, process route, shifts, planned losses, utilities, layout and qualification-document requirements.